

Operational Health Dashboard Fabricated Metrics Automation: Zero Active Alerts, Always
A safe mock mode is only safe if production code actually knows it is not in it
Keeping a mock, in-memory implementation of a data layer alongside a real, Supabase-backed one is a genuinely sound engineering pattern — it lets a team build and demo a product against safe, synthetic data without touching anything real, and lets automated tests run fast and deterministically. The entire value of that pattern depends on one condition holding everywhere: every function that reads or writes data has to actually check which mode it is running in, and route accordingly. A function that was written before the real Supabase-backed implementation existed, and simply never updated to add that check when the real implementation arrived, does not fail loudly — it keeps compiling, keeps returning a value of the right shape, and keeps looking, from the outside, exactly like it is doing its job.
How the underlying problem shows up before you fix it
A data-access function inside a codebase that maintains a deliberate mock/production split contains no branch at all checking which mode is active — it always executes the same code path regardless of environment.
An admin or operational dashboard reads counts, averages and breakdowns that are technically well-formed (correct types, sensible-looking numbers) but are computed entirely from an in-memory array seeded once and never connected to the organization's real data.
A function inside the layer specifically labeled as the PRODUCTION (Supabase-backed) implementation is, on inspection, a literal placeholder: a hardcoded return value that ignores every argument passed to it, including the organization identifier.
A hardcoded stub returning an empty list or a zero count is functionally indistinguishable, from the outside, from a genuinely healthy system with nothing to report — both render an empty or all-zero dashboard, and neither one raises an error a monitoring system would catch.
Two independent workers or processes reading the same "next available" queued item and both proceeding to act on it — a duplicate-claim race — often lives in the exact same code path as the counts a dashboard reads, because both consume the identical queue.
How a Health screen that had never actually looked at production got its numbers fixed
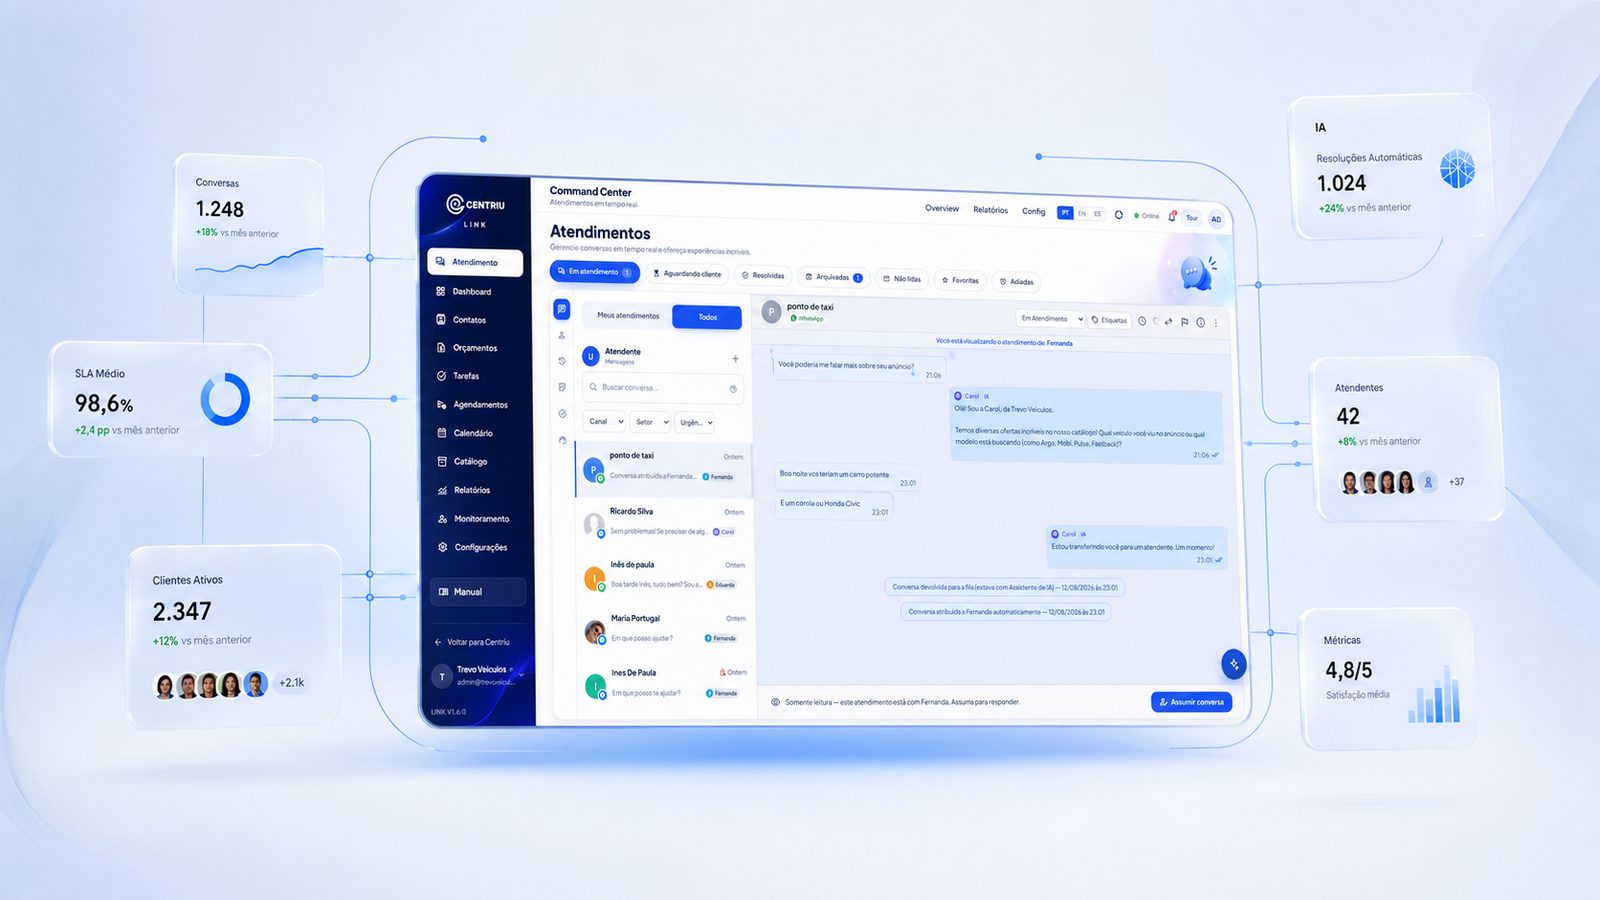
Centriu Axiom's admin Health screen is built to answer a specific operational question for a team running the product: how many jobs are queued, running, succeeded or failed in the last 24 hours; how long jobs are taking on average; how much storage an organization is using against its plan; how many requests were blocked by rate limiting; how many sessions are currently active; and, on a companion Errors tab, how many runtime errors have occurred and how they break down by severity and source.
Every one of those numbers, before this fix, was computed inside a single function reading directly from `_store` — an in-memory JavaScript object holding synthetic job, evidence, session and audit records, built specifically for the product's own mock mode. That function contained no check of any kind for which mode the product was actually running in. In a real, live deployment serving a real organization's real Supabase-backed data everywhere else in the product, this one specific screen was still reading the same synthetic array a local demo would use — regardless of environment, and regardless of how much real activity the organization actually had. The companion Errors tab had the identical structure: its own stats function read directly from the same mock store's runtime-errors array, synchronously, with no environment awareness at all. The raw structured-log feed underneath both screens had the same defect a third time, reading directly from the mock store's own audit array.
A separate, and in some ways more direct, version of the same underlying gap was found specifically inside the code that IS labeled as the Supabase-backed, production implementation of these same services — meaning someone had already started building the real version, and two specific functions inside it had simply never been finished. The function meant to return an organization's currently active alerts read, in full: `getActive(_orgId) { return [] }` — an empty array, unconditionally, with the organization identifier explicitly discarded (the underscore prefix on the parameter name is the codebase's own convention for "accepted but intentionally unused"). The function meant to return job counts by status read, in full: `countByStatus() { return { queued: 0, running: 0, succeeded: 0, failed: 0, canceled: 0 } }` — every count hardcoded to zero, for every organization, unconditionally. Neither function had ever been connected to a real query. A real organization using the genuinely production-configured path of the product would see its own Health screen report zero active alerts and zero jobs of every status, permanently, regardless of how many alerts were actually open or how many jobs were actually queued and running at that exact moment.
The fix replaces all of it with real, organization-scoped Supabase queries. Job status counts, evidence counts, rate-limit-block counts and active-session counts are computed as head-counts (`select('*', { count: 'exact', head: true })`) scoped to the organization and, where relevant, a 24-hour window — a query pattern that returns an exact count without transferring the underlying rows at all. Average job duration is estimated from a bounded sample of the 200 most recently completed jobs, rather than attempting to average every job an organization has ever run. The active-alerts function now runs a real query filtered to the organization and an active status, ordered by recency. Error statistics split total and unresolved counts (both exact head-counts) from a severity/source breakdown, which is computed from a bounded, recent sample of up to 500 rows rather than the organization's entire error history — a deliberate choice avoiding an unbounded read while keeping the breakdown genuinely representative of recent activity. The structured-log feed now calls the same swappable audit service the rest of the product already uses, rather than reaching into the mock store directly.
A separate, unrelated defect was found in the identical job-queue code path while making these fixes, because the function claiming the next queued job for execution sits directly next to the job-count function in the same file. That claim function fetched the oldest queued job and then issued a plain, unconditional update flipping it to "running" — with no check that the job was still queued at the moment of the update. Two workers (or two browser tabs, or an overlapping retry) calling this function at nearly the same moment could both fetch the identical queued job, and both unconditional updates would succeed, meaning both workers would proceed to execute the same job. The fix makes the claim atomic: the update now carries an additional `.eq('status', 'queued')` condition, so only the update that actually finds the row still queued succeeds; a second, losing caller's conditional update matches zero rows, is read back as `null`, and correctly reports no job was available to claim.
What is actually built today
Every number on Centriu Axiom's admin Health screen — job counts by status, average job duration, storage usage, rate-limit blocks, active sessions — is computed from real, organization-scoped Supabase queries when the product is running against real data, not from an in-memory array with no connection to production.
The Supabase-backed active-alerts lookup runs a real, organization-filtered query for alerts in an active status, replacing a function that previously returned an empty array unconditionally regardless of the organization asked about.
The Supabase-backed job-count-by-status lookup runs real, organization-scoped per-status counts, replacing a function that previously returned zero for every status unconditionally.
The Errors tab's totals, unresolved count, and severity/source breakdown are computed from real, organization-scoped queries — an exact head-count for the totals, a bounded recent sample of up to 500 rows for the breakdown.
Claiming a queued job for execution is now an atomic, conditional update (only succeeds if the job is still genuinely queued at that exact moment), closing a race where two concurrent workers could both claim and execute the identical job.
A screen reporting zero of everything, regardless of the truth underneath it (illustrative framing of the actual measured finding)
Before the fix, an operations team opening Centriu Axiom's own Health screen for a real, actively used organization would see zero active alerts and zero jobs of every status listed — not because nothing was happening, but because the two functions responsible for those specific numbers were hardcoded to report exactly that, for every organization, unconditionally. A genuinely quiet system and a system whose monitoring had silently stopped looking at reality were, from that one screen, indistinguishable. After the fix, the same screen reflects the organization's actual job counts and actual open alerts, queried directly and scoped to that organization, at the moment the screen is opened.
What changes operationally
Centriu Axiom's own admin Health and Errors screens — job counts, average duration, storage usage, rate-limit blocks, active sessions, error totals and their severity/source breakdown, and the raw structured-log feed — now reflect an organization's real, current Supabase data rather than an in-memory mock array or a hardcoded stub, closing a gap where the product's own operational monitoring could report a healthy, quiet system regardless of what was actually happening in production.
When this is not the right fit
This automation governs Centriu Axiom's own internal admin observability screens — it does not change any customer-facing feature, and a team that never opens its own Health or Errors dashboard would not have been affected by these specific numbers being wrong, though the underlying job-claim race condition affected job execution correctness regardless of whether anyone was looking at the dashboard at all.
A dashboard that always looks calm vs. one that actually queries production
A dashboard hardcoded to report zero incidents is, in one narrow sense, the easiest dashboard to build and the cheapest to maintain — it never breaks, never times out, and never shows an alarming number. It is also worthless as an operational signal, and actively worse than no dashboard at all, because a team trusting it has strictly less information than a team that knows to go check the database directly. Querying real, organization-scoped production data for every figure costs more (real queries can be slow or fail, and needed deliberate bounding to stay safe at scale) but is the only version of this screen that can actually do the job it exists to do.
Related systems
Main system: Centriu Axiom.
What it does NOT do
- Does not change what a Centriu Axiom customer sees or experiences directly — this fix corrects the product's own internal admin Health and Errors screens, used by the team operating the product, not a customer-facing feature.
- Does not retroactively reconstruct historical health data for the period before this fix shipped — a team wanting to know what its true job/alert/error counts were during that window would need to query the underlying Supabase tables directly for that historical range.
- Does not change how jobs, alerts or errors are actually generated or classified — this fix corrects only how existing data is counted and displayed, and closes an unrelated race in how a queued job is claimed for execution.
- Does not overlap with the other two fixes shipped in the same commit (a data-retention cleanup that fabricated its own deleted-row count, and a usage-quota counter with a stale-period read and a non-atomic increment) — both are covered on their own companion pages.
- Does not claim every Axiom dashboard or metric was affected — this fix is scoped specifically to the functions named above (Health screen core metrics, active alerts, job-status counts, error stats, structured logs, and job claiming); other parts of the product were not found to share this specific defect.
Security and governance
Centriu Axiom's own admin Health and Errors screens now query real, organization-scoped production data rather than an in-memory mock store or a hardcoded stub — closing a gap in the product's own operational self-monitoring. Any personal or usage data referenced in these internal admin views remains subject to Brazil's LGPD (Law No. 13,709/2018). Full detail on access control and audit trails lives at /governanca and /iso.
Pricing and contracting
Available by monthly subscription, with tiered plans. Values and terms come from the official pricing table at /precos (Centriu's central source — never restated here).
Frequently asked questions
Was this a customer-facing bug, or an internal one?
Internal — the affected screens are Centriu Axiom's own admin Health and Errors dashboards, used by the team operating the product. A separate, related fix in the same investigation (an atomic job-claim update) affects job execution correctness regardless of who is looking at any dashboard.
How was it confirmed these were hardcoded stubs and not just bugs in a query?
By direct inspection of the source: the active-alerts function's entire body was `return []`, discarding its own organization-ID argument, and the job-count function's entire body was a fixed object with every status set to zero — neither contained a query of any kind.
Did this affect real production data, or only what the dashboard displayed?
Only what the Health and Errors dashboards displayed — the underlying job, alert and error data itself was unaffected by this specific defect. The separate job-claim race, closed in the same fix, could affect which worker actually executed a given job.
Why would a hardcoded stub like this go unnoticed?
Because its output — an empty list, an all-zero count object — is exactly what a genuinely quiet, healthy system would also produce. Nothing about the stub's return value looks wrong on its own; only comparing it against the organization's actual, known activity reveals the gap.
Is the mock-vs-production split itself the problem?
No — keeping a mock implementation alongside a real one is a reasonable, common pattern. The gap was specific functions never being updated to check which mode was active, and two specific functions inside the production implementation itself never being finished.
What does Centriu Axiom cost?
It is sold by subscription with a published starting price — exact current values are on the central pricing page.
See how Centriu Axiom monitors its own real production data
Reach our commercial team directly, or leave your details below — we'll follow up with guidance for your case.